ea_normalise
ea_normalise.RdA function to normalise, or re-scale, a numerical vector such as a condition variable to become a value between 0 and 1, bound by an upper and a lower reference level.
Usage
ea_normalise(
  data = NULL,
  vector = NULL,
  upper_reference_level = NULL,
  lower_reference_level = 0,
  scaling_function = "linear",
  reverse = FALSE,
  break_point = NULL,
  optimum = NULL,
  plot = FALSE
)
Arguments
- data
Data set of class sf
- vector
Numerical vector inside
datawhich should be normalised- upper_reference_level
The upper reference level against which to normalise the
vector. Can be a single number or a vector of length equal tovector. If the indicator direction is negative,upper_reference_levelshould still represent the highest variable limit, i.e. the worst condition in that case.- lower_reference_level
The lower reference level against which to normalise the
vector. Defaults to 0. Can be a single number or a vector of length equal tovector. If the indicator direction is negative,lower_reference_levelshould still represent the lowest variable limit, i.e. the best condition in that case.- scaling_function
one of c("linear", "sigmoid", "exponential convex", "exponential concave")
- reverse
Logical. Is the indicator direction negative (i.e. a high variable value should give a low indicator value)
- break_point
Numerical vector or single value indicating the value of the variable which should be scaled to 0.6 in the indicator.
- optimum
Numerical vector or single value indicating the upper reference value for a two-sided indicator.
- plot
Logical. Wheter to return a plot comparing normalised and raw values, or to return the normalised values (default).
Value
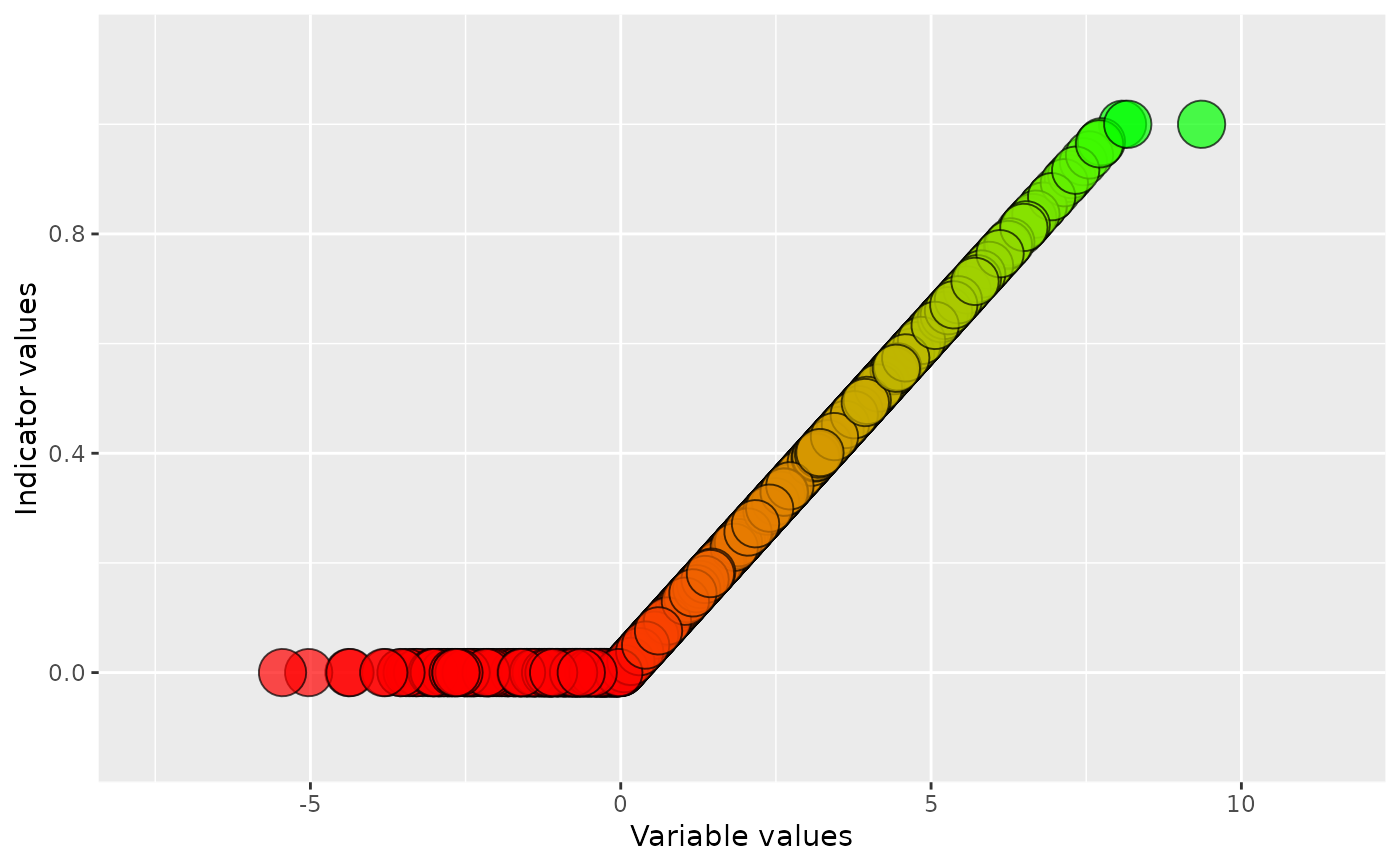
If plot = TRUE return a ggplot comparing normalised and raw values. If plot = False return the numerical vector, a normalised version of vetcor
Examples
data("ex_polygons")
ea_normalise(data = ex_polygons,
            vector = "condition_variable_2",
            upper_reference_level = 8,
            plot=TRUE)