2 Nature index product
Author and date:
Chloé R. Nater
October 2023
Ecosystem |
Økologisk egenskap |
ECT class |
|---|---|---|
Våtmark (også fjell og skog) |
Biologisk mangfold |
Compositional state characteristic |
2.1 Introduction
The Norwegian Nature Index (NI) is a composite metric for quantifying the state of biodiversity in an abundance-context. It has been established and published for the first time in 2010 and has since been updated for years 2011, 2012, 2013,2014, and 2019. It is owned and presented by the Norwegian Environmental Agency and the latest iteration, including a lot of information, can be found on its webpage: https://www.naturindeks.no/
NI is a composite index made up of single- and multi-species (abundance) indicators that are scaled to fall between 0 and 1 (where 0 = absent/extinct and 1 = abundance corresponding to expected abundance in a natural environment with minimum human disturbance). During the aggregation process, indicators are weighed on three levels: functional group (trophic weights), spatial coverage (area weights)and key function (key weights).
The methodology for calculating NI is well established and has been described in detail in NINA reports 347,1 425,2 797,3 1130,4 and 18865 and several international scientific articles6 and will not be elaborated on further here.
It is important to note that the NI products that are used indicators in Ecosystem Condition Assessment and the Norwegian Nature Index that has been previously published, and will be published again in 2025, as a national biodiversity assessment are not identical. We use modified versions of the NI in Ecosystem Condition Assessments, the details of which will be described below. Moving forward, it will be important to stress this distinction, and we will therefore start talking about “NI products” when referring to composite indices built based on data in the Nature Index Database (see below) that are not identical to the regularly published national assessments (i.e. what is published on https://www.naturindeks.no/).
2.2 About the underlying data
The data underlying NI products is stored in the Nature Index Database at https://naturindeks.nina.no/. The database needs login credentials for access.
In the database, data on a large number of indicators are stored separately for different areas and different years. The areas and years available for each indicator vary but most indicators have data for years 2000, 2010, 2014, and 2019. The database currently also holds data for 1990, but for many indicators, no data is available for this year. New data will be added in 2024, and we are currently working on extending the database such that it may also hold data from years in between official NI updates.
The data held in the NI database are a mixture of observational data, modelled estimates, and quantitative expert assessments.
Here, we focus primarily on showcasing the workflow for creating an NI product for wetlands, and the following table gives an overview of all the indicators included in the official NI for wetlands in 2020. It also provides information on each indicators trophic level, underlying data, whether we expect updated indicator data towards NI 2025, and additional notes.
| ID | Navn | Nøkkelindikator_NI2020 | Funksjon | Datagrunnlag | Forventet_med_NI2025 | Merknader |
|---|---|---|---|---|---|---|
| 7 | Atlantisk høgmyr areal | Ja | ikke definert | Ekspertvurdering. Tilstandsnivå 1-5 på kommunenivå. | Ja | Indikatoroppdatering realistisk i følge ansvarlig (Jarle Bjerke) |
| 338 | Brunmyrak | Nei | Primærprodusent | Modellering av karplante-forekomst basert på GBIF data. | Ja | Automatisert arbeidsflyt satt opp. |
| 340 | Dikesoldogg | Nei | Primærprodusent | Modellering av karplante-forekomst basert på GBIF data. | Ja | Automatisert arbeidsflyt satt opp. |
| 300 | Dobbeltbekkasin | Nei | Mellompredator | Beregning fra / modellering av TOV-E data, samt noe (?) ekspertvurdering. | Ja | Arbeidsflyt delvis automatisert. Videreutvikles i løpet av 2023. |
| 211 | Engmarihand | Nei | Primærprodusent | Modellering av karplante-forekomst basert på GBIF data. | Ja | Automatisert arbeidsflyt satt opp. |
| 301 | Enkeltbekkasin | Nei | Mellompredator | Beregning fra / modellering av TOV-E data, samt noe (?) ekspertvurdering. | Ja | Arbeidsflyt delvis automatisert. Videreutvikles i løpet av 2023. |
| 51 | Fjellgittermose | Nei | Primærprodusent | Ekspertvurdering. | Nei | Det kommer ikke til å være datagrunnlag for oppdatering av indikatoren mot NI 2025. |
| 303 | Gluttsnipe | Nei | Mellompredator | Beregning fra / modellering av TOV-E data, samt noe (?) ekspertvurdering. | Ja | Arbeidsflyt delvis automatisert. Videreutvikles i løpet av 2023. |
| 304 | Grønnstilk | Nei | Mellompredator | Beregning fra / modellering av TOV-E data, samt noe (?) ekspertvurdering. | Ja | Arbeidsflyt delvis automatisert. Videreutvikles i løpet av 2023. |
| 305 | Gulerle | Nei | Mellompredator | Beregning fra / modellering av TOV-E data, samt noe (?) ekspertvurdering. | Ja | Arbeidsflyt delvis automatisert. Videreutvikles i løpet av 2023. |
| 337 | Hvitmyrak | Nei | Primærprodusent | Modellering av karplante-forekomst basert på GBIF data. | Ja | Automatisert arbeidsflyt satt opp. |
| 420 | Kysttorvmose | Nei | Primærprodusent | Ekspertvurdering. | Nei | Det kommer ikke til å være datagrunnlag for oppdatering av indikatoren mot NI 2025. |
| 14 | Mosesumpløper | Nei | Mellompredator | Ekspertvurdering. | Nei | Det kommer ikke til å være datagrunnlag for oppdatering av indikatoren mot NI 2025. |
| 307 | Myrsnipe | Nei | Mellompredator | Beregning fra / modellering av TOV-E data, samt noe (?) ekspertvurdering. | Ja | Arbeidsflyt delvis automatisert. Videreutvikles i løpet av 2023. |
| 125 | Myrtelg | Nei | Primærprodusent | Modellering av karplante-forekomst basert på GBIF data. | Ja | Automatisert arbeidsflyt satt opp. |
| 142 | Palsmyr areal | Ja | ikke definert | Ekspertvurdering med hensyn til overvåkingsdata fra 2007. | uavklart | Tidligere overvåkingsprogramm for palsmyr er nedlagt, og ny overvåkingsprogramm er ikke under regi til NINA. Det er uavklart hvorvidt den nye overvåkingsprogrammet er kompatibelt med det tidligere og med rammeverket generelt. |
| 436 | Tamrein | Nei | Plantespisere og filterspisere | Offentlige tidsserier for antall tamrein på kommunenivå. | Nei | Tamrein droppes fra NI2025 siden den har lite med “ville bestander” å gjøre og er svært kontroversiell. |
| 308 | Rødstilk | Nei | Mellompredator | Beregning fra / modellering av TOV-E data, samt noe (?) ekspertvurdering. | Ja | Arbeidsflyt delvis automatisert. Videreutvikles i løpet av 2023. |
| 167 | Sennegras | Nei | Primærprodusent | Modellering av karplante-forekomst basert på GBIF data. | Ja | Automatisert arbeidsflyt satt opp. |
| 309 | Sivsanger | Nei | Mellompredator | Beregning fra / modellering av TOV-E data, samt noe (?) ekspertvurdering. | Ja | Arbeidsflyt delvis automatisert. Videreutvikles i løpet av 2023. |
| 310 | Sivspurv | Nei | Mellompredator | Beregning fra / modellering av TOV-E data, samt noe (?) ekspertvurdering. | Ja | Arbeidsflyt delvis automatisert. Videreutvikles i løpet av 2023. |
| 339 | Smalsoldogg | Nei | Primærprodusent | Modellering av karplante-forekomst basert på GBIF data. | Ja | Automatisert arbeidsflyt satt opp. |
| 311 | Småspove | Nei | Mellompredator | Beregning fra / modellering av TOV-E data, samt noe (?) ekspertvurdering. | Ja | Arbeidsflyt delvis automatisert. Videreutvikles i løpet av 2023. |
| 184 | Stakesvanemose | Nei | Primærprodusent | Ekspertvurdering. | Nei | Det kommer ikke til å være datagrunnlag for oppdatering av indikatoren mot NI 2025. |
| 196 | Sveltstarr | Nei | Primærprodusent | Modellering av karplante-forekomst basert på GBIF data. | Ja | Automatisert arbeidsflyt satt opp. |
| 313 | Trane | Nei | Mellompredator | Beregning fra / modellering av TOV-E data, samt noe (?) ekspertvurdering. | Ja | Arbeidsflyt delvis automatisert. Videreutvikles i løpet av 2023. |
| 216 | Villrein | Nei | Plantespisere og filterspisere | Integrert modellering av ulike typer overvåkingsdata. | Ja | Ny arbeidsflyt og oppdatering av modellen er ønskelig, men ikke finansiert så lenge. Noe uenighet om tilnærming, samt overlap med villreinnormen. |
| 436 | Tamrein | Nei | Plantespisere og filterspisere | Offentlige tidsserier for reintall av tamrein, brutt ned på kommunenivå. | Ja | Inklusjon av tamrein i NI2025 (og NI-produkter for fagsystemet for økologisk tilstand) kan være aktuell å tas opp med NI faggruppa og eksperter igjen. |
2.2.1 Representativity in time and space
NI products for inclusion in Ecological Condition Assessments are can currently be calculated for years 1990, 2000, 2010, 2014, and 2019, which correspond to the years in which the official NI updates took place. Ecosystem level NI products are calculated for 5 major regions in Norway: “Nord-Norge” (northern Norway), “Sør-Norge” (southern Norway), “Midt-Norge” (central Norway), “Vestlandet” (western Norway), and “Østlandet”. In theory, it would be possible to calculate NI products also for other, including smaller, spatial units, but this would require additional coding. It is also important to note that the spatial resolution of the indicators that make up a specific NI product can vary substantially. As many indicators have rather crude spatial resolution, scaling NI products down to smaller spatial units may not make a lot of sense. Consequently, it is important to keep in mind that NI products, even plotted to a map, quantify trends in biodiversity at relatively large spatial scales, and are not suitable for quantifying and comparing biodivseristy in small and very localised areas.
2.2.2 Original units
The NI is a composite index made up of scaled indicators. NI products are therefore numbers between 0 and 1 (more specifically a set of simulated numbers resulting from a bootstrap, and derived summary metrics including mean, median, and 95 % confidence intervals) that have no unit.
2.3 Ecosystem characteristic
2.4 Collinearities with other indicators
There is a substantial potential for collinearity between NI products and other indicators, primarily due to the fact that a range of indicators that may be part of an NI product for a given ecosystem have been suggested to enter the Ecological Condition Assessment also as indicators in their own right or through other composite indicators. For the wetlands ecosystem, this is the case, for example, for the bird indicators based on data from “Hekkefuglovervåkingen”. These indicators form an important proportion of wetlands NI products (at least how they are defined now) but also enter into the Ecological Condition Assessment as a composite bird indicator. Collinearity and double-use of data are issues here, and we discuss these at the end of the introduction of this chapter below.
2.5 Reference condition and values
2.5.1 Reference condition
The reference condition is defined along the same lines for NI and for other indicators in Ecological Condition Assessments.
2.5.2 Reference values, thresholds for defining good ecological condition, minimum and/or maximum values
As NI products are already scaled to range from 0 to 1 and reference conditions are set according to the same approach, the reference value is 1. For wetlands ecosystems in particular, we have not yet discussed the definition of “good ecological condition”, but in the Ecological Condition Assessments for forest and mountain ecosystems, the default 0.6 was used as “good ecological condition”. To what degree this is appropriate is difficult to judge. It may well be best to use 0.6 due to its consistency previous work as it would be challenging to at least empirically determine what is “good enough” condition for a highly derived variables such as NI products.
2.6 Uncertainties
Calculated NI products are actually composed of a pre-defined number of random samples from a probability distribution drawn during an internal bootstrap implemented in the R package NIcalc.
These draws can be summarised with metrics such as mean, median, confidence intervals.
etc.
The degree of uncertainty is determined by a) the uncertainty associated with each indicator’s data as deposited in the NI database and b) the uncertainty resulting from imputation of missing values.
Besides these “quantitative” sources of uncertainty, there is also “qualitative” uncertainty linked to using NI products as indicators in Ecological Condition Assessments. This is linked to methodological questions regarding how (and perhaps if) highly processed composite indices should be included as indicators to make other composite indices. While some of these questions are of a more philosophical nature, some more pragmatic ones include decisions about which indicators to include/exclude (especially considering indicators that may get used directly and via NI products and indicators that do not really quantify species abundance), how to weigh indicators, and whether or not to impute NA values as part of generating the NI product.
We present some thoughts and suggestions regarding these latter questions in the next section.
2.7 Recommendations for using NI products in Ecological Condition Assessments
NI products used for ecological condition assessments may deviate from the regularly published official version of NI in terms of 1) indicator selection, 2) weighting, and 3) treatment of missing data.
The general rule is that NI products used for ecosystem condition assessments should follow a definition of NI as an indicator of the abundance of species. This means that the indicators that are part of such NI products should be indicators representing abundance and/or population status of specific species and species groups. Indicators that describe properties linked to the condition and/or occurrence of habitat types, on the other hand, should be dropped. For wetlands, for example, this includes the NI indicators “Atlantisk høgmyr areal” and “Palsmyr areal”.
The second group of indicators that should not be included in NI products are indicators that are also used as additional independent indicators in the ecosystem assessment, or that use the same underlying data as other indicators in the ecosystem assessment. This includes, e.g., indicators such as breeding birds, wolves, small rodents etc. Including the same data/information through different channels is problematic for several reasons including artificially increased indicator weight, inflated precision of the resulting aggregate metrics, high correlations among indicators, and increased risk for mistakes due to parallel workflows.
The last group of indicators from the NI database that needs discussing are indicators based on expert knowledge. It has been decided that ecosystem condition assessments using the IBECA method should only include indicators based on data and model predictions. To what degree NI products that contain a portion of indicators based on expert knowledge should be allowed will require discussion. It is clear, however, that expert knowledge can also be considered data. There is also large variation in how expert elicitation is conducted which will influence the quality and transparency of the this kind of data.
Considering all the groups of indicators that should not be included in NI products for ecosystem condition assessments opens up a discussion on whether, instead of using a composite index across a small and very unbalanced set of species (groups), a better approach might be to design NI products that represent specific taxonomic and/or functional species groups. Take, for example, the wetlands NI product presented below: if the bird indicators are removed as they are a separate index, and the four indicators representing expert knowledge on rare mosses and insects are discontinued, all that remains are eight species of vascular plants, wild reindeer, and semi-domestic reindeer. Instead of averaging across plants and reindeer here, it may be more sensible to make an NI product for vascular plants, and potentially include reindeer (either joint or divided into wild and semi-domestic) as a separate indicator.
Weighting of indicators during aggregation happens at three levels in the NI framework: area weighting, trophic weighting, and key indicator weighting. Area and trophic weighting aim to smooth over imbalances in spatial and taxonomic coverage of indicators while increased weights for a priori defined key indicators are supposed to increase the influence of indicators that are thought to be functionally important species or habitats. Area weighting is central to the method and should always be done when calculating NI products, while the need for trophic weighting depends on the indicator selection of the specific NI product: weighting by trophic group can be useful for indicator sets that are taxonomically diverse while it is largely moot for sets of indicators representing functionally and/or taxonomically closely related species. For the majority of NI products for inclusion in ecosystem condition assessments key indicator weighting will not be relevant because most NI key indicators fall into the categories of either habitat indicators and/or indicators that are used independently in the assessments and are therefore removed from NI products. If any key indicators remain in the relevant indicator set after that, there is a good chance it will be only one or two, and allocating literally half the weight in a composite index to a single indicator is not reasonable.
NI indicators are normalised (i.e. scaled relative to their reference values) at what is referred to as the BSU level, or basic spatial units.
This is the spatial resolution of the raw observation data, and the reference values have the same spatial resolution as the observation data.
Quite often the BSU it is a municipal scale, but not always.
The EAA (ecosystem assessment area), however, is typically much larger, with only five regions in Norway.
Therefore, scaled indicator valeus are aggregated to produce regional estimates, with the effect that the regional estimated now represents the (area weighted) condition of the BSUs, and not the status of the population.
An alternative to this, for indicators where the raw data is in the form of counts or mass (densities are not suited), one might sum the variable and the reference values for each region and then scale the variable based on these sums (e.g. number of individuals).
This approach would produce an indicator which reflect the population status rather than the mean status for any given area. We note, however, that this alternative approach is not (yet) implemented as a routine in the NIcalc R package, and code to implement and execute it would have to be developed first.
The last adjustment that can be made for NI products for use in ecosystem condition assessments deals with how gaps (NA values) in the data are treated. The official NI has always had a time series perspective, i.e. the focus lies on changes in the index over time. To be able to compare NI across different years it is necessary to impute missing indicator values as this ensures that the same (complete) set of indicators is used every year. The MICE algorithm that is used for the NA imputation is a practical solution that works well enough when there are many indicators and as long as the data gaps are randomly distributed across years. That being said, it has not been tested how well the imputation performs with smaller indicator sets, which is going to be the case with the NI products for use in the ecosystem condition assessments. The tidiest and most robust approach as of now is therefore to not impute missing data and calculate NI products based on indicators without missing data in the relevant time period. This is likely to be the best way to go as long as the focus of ecosystem condition assessments does not shift over to a primary focus on time series.
2.8 References
2.9 Analyses
The following analysis workflow is almost entirely arranged in functions.
The functions for the different steps are from the NIflex R package (https://github.com/NINAnor/NIflex).Many of the NIflex functions call on functions from NIcalc (https://github.com/NINAnor/NIcalc), the R package written for entering and extracting data from the NI database and calculating NI products from it.
Before proceeding any further, we therefore need to make sure that both of these packages and their dependencies are installed:
if(system.file(package = 'NIcalc') == ""){
  devtools::install_github("NINAnor/NIcalc", build_vignettes = TRUE)
}

if(system.file(package = 'NIflex') == ""){
  devtools::install_github("NINAnor/NIflex", build_vignettes = TRUE)
}
`NIflex`` was written to provide a flexible workflow for calculating a range of NI products including the original NI for all seven main ecosystems, a range of previously used thematic indices, fully custom indices and – most important here – NI products aimed for use in Ecological Condition Assessments for forest, mountain, and wetland ecosystems.
Below I walk through the workflow for an NI product for the Ecosystem Condition Assessment for wetlands. I will not provide a lot of additional details on the functions and their arguments here as all necessary information is included in the function documentation.
2.9.1 Data sets
2.9.1.1 Nature Index database
All data required for making the NI product are contained in the NI database (https://naturindeks.nina.no/).
Accessing the database requires a username and a password.
At present, this setup works with the username and password saved as personal environmental variables NIDB_USERNAME and NIDB_PASSWORD.
NIdb_username <- Sys.getenv("NIDB_USRNAME")
NIdb_password <- Sys.getenv("NIDB_PASSWORD")
User credentials can be requested from NINA.
2.9.1.2 Regions
As mentioned above, ecosystem-level NI products are calculated for five major regions in Norway: “Nord-Norge” (northern Norway), “Sør-Norge” (southern Norway), “Midt-Norge” (central Norway), “Vestlandet” (western Norway), and “Østlandet”. For georeferencing values and plotting them onto a map, shapefiles for these regions are required. The relevant files can be downloaded in JSON format from the NI API (https://ninweb08.nina.no/NaturindeksAPI/index.html) and subsequently need to be transformed into shapefiles.
In this workflow, we access the shapefiles that are deposited on NINA’s internal file system:
shapeLibraryPath <- "/data/P-Prosjekter/41201611_naturindeks_2021_2023_vitenskapelig_ansvar/Shapefiles"2.9.2 Workflow options
`NIflex`` offers a workflow for calculating NI products that can be customized in terms of a range of options. So next, we set the global options for calculating our wetlands NI product, starting with the years of data we want to include. Since we will not use NA imputation here, we drop the first year with available data for in the NI database (1990) as many indicators do not actually have values for this year.
years <- c("2000", "2010", "2014", "2019")Next, we decide what type of output we want and whether or not to impute missing values
OutputType <- "EcologicalCondition"
EC_ecosystem <- c("Wetlands", "Våtmark")

NAImputation <- FALSE
and continue to set how we want indicators to be weighed. At present, we will not use key indicator weights, but we will still weigh according to area and trophic group:
KeyIndicators <- FALSE
KeyWeight <- 0.5

AreaWeights <- TRUE

TrophicWeights <- TRUE
We also need to state that we want to use Norwegian indicator names
norwegianNames <- TRUEand set the way in which we want to specify which indicators are dropped. There are two options for this: “pre-defined” drops the hard-coded set of indicators that should be dropped in any case. So far, there is only one indicator that gets dropped for wetlands by default and that is “lavhei” (due to low representativeness for the ecosystem). The alternative is to set the mode to “custom” and specify which indicators should be dropped. We will demonstrate this here as we would also like to also drop the two indicators that do not represent species abundance but habitat condition, “Atlantisk høgmyr areal” and “Palsmyr areal”.
DropIndMode <- "custom"
DropIndList <- c(7, 142, 155)

if(DropIndMode == "pre-defined"){DropIndList <- NULL}
With the final options, we choose whether we want dataset diagnostics to be calculated and also whether we want to run a test run or a full run:
Diagnostics <- TRUE # Yes
TestRun <- FALSE # No
The difference for the latter is that in a test run, we only run NA imputation and bootstrap for 10 iterations instead of 1000, which makes the runtime of the workflow a lot more “practical” (but 1000 or even more iterations should be run for the final results).
2.9.3 Scaled indicator values
Before beginning index calculation, there are a few more conditional variables that need to be set, namely the Norwegian name of the ecosystem and the lists of indicators to use and indicators to drop.
ecosystem_use <- EC_ecosystem[2]
indicators_use <- NULL

dropInd <- selectDropIndicators(DropIndMode = DropIndMode,
                                OutputType = OutputType,
                                ecosystem = ifelse(OutputType %in% c("NatureIndex", "EcologicalCondition"), ecosystem_use, NULL),
                                customList = DropIndList)
Note that we set indicators_use to NULL because we are working with a pre-defined set of indicators (i.e. the set linked to NI for wetlands).
We also need to set variables “theme” and “funArguments” to “none” and NULL, respectively (these are used for controlling workflow elements linked to thematic indices):
theme <- "none"
funArguments <- NULL
With this, we are ready to move ahead with the calculation of our wetlands NI product.
For this, we use NIflex::calculateCustomNI(), a wrapper function that downloads the data, runs dataset diagnostics (if requested), imputes NA values (if requested), and calculates the NI product using functions from the NIcalc package:
CustomNI <- calculateCustomNI(ecosystem = ecosystem_use,
                              indicators = indicators_use,
                              theme = theme,
                              dropInd = dropInd,
                              username = NIdb_username,
                              password = NIdb_password,
                              KeyIndicators = KeyIndicators,
                              KeyWeight = KeyWeight,
                              AreaWeights = AreaWeights,
                              TrophicWeights = TrophicWeights,
                              NAImputation = NAImputation,
                              years = years,
                              OutputType = OutputType,
                              funArguments = funArguments,
                              Diagnostics = Diagnostics,
                              TestRun = TestRun,
                              norwegianNames = norwegianNames,
                              saveSteps = FALSE)
After calculating the index values, we can extract summary metrics for a specified year and match them to geospatial data for further analysis and/or inclusion in the Ecosystem Condition framework:
CustomNI_map <- geomapNI(Index = CustomNI$CustomIndex,
                         year = 2019,
                         OutputType = OutputType,
                         ecosystem = ecosystem_use,
                         shapeLibraryPath = shapeLibraryPath)
Next we can have a look at some visualizations of our NI product. First, we can plot the “traditional” time-series plot of the index averaged across regions and calculate the corresponding summary metrics:
Index <- CustomNI$CustomIndex
plot(Index$wholeArea, main = "Custom index", cex = 1, lwd = 2, shade = TRUE)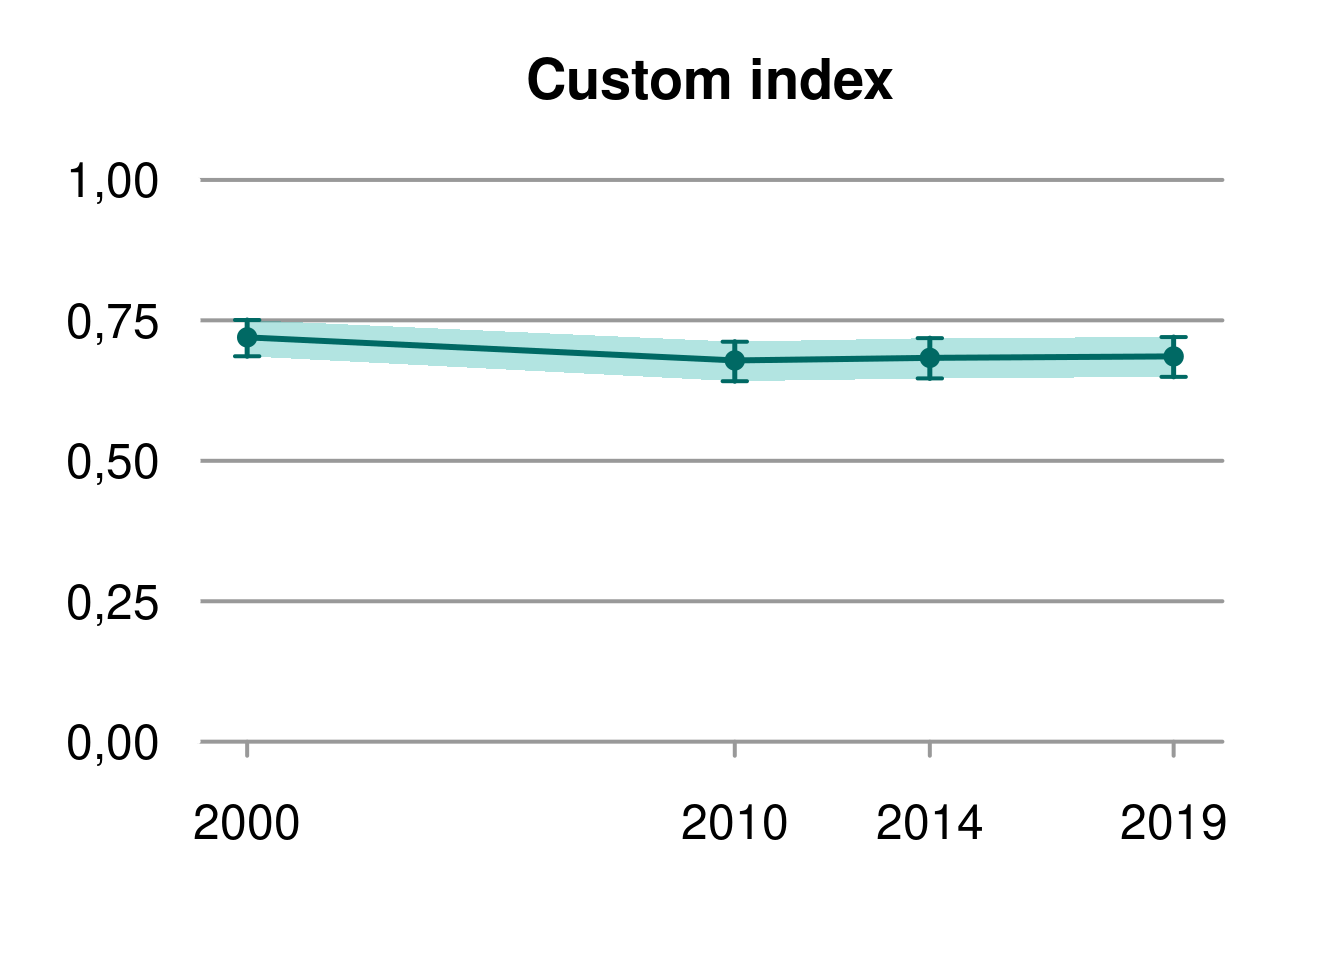
data.frame("Region"= rownames(summary(Index$wholeArea)), summary(Index$wholeArea), check.names = F) %>%
  flextable() %>%
  theme_vanilla() %>%
  set_table_properties(layout = "autofit")
Region |
2.5% |
median |
97.5% |
displacement |
|---|---|---|---|---|
wholeArea 2000 |
0.6860950 |
0.7197308 |
0.7506189 |
-0.007325478 |
wholeArea 2010 |
0.6416694 |
0.6786581 |
0.7119931 |
-0.008836575 |
wholeArea 2014 |
0.6466425 |
0.6832561 |
0.7183298 |
-0.004835020 |
wholeArea 2019 |
0.6494270 |
0.6858428 |
0.7202780 |
-0.006643143 |
The summary metrics (here median) for any given year can then be plotted onto a map by matching them up to the shapefiles:
plotNI_Map(shp = CustomNI_map,
           year = 2019,
           OutputType = OutputType,
           ecosystem = ecosystem_use,
           plotMedian = TRUE, plotCI = FALSE, plotDisplacement = FALSE,
           interactiveMap = FALSE)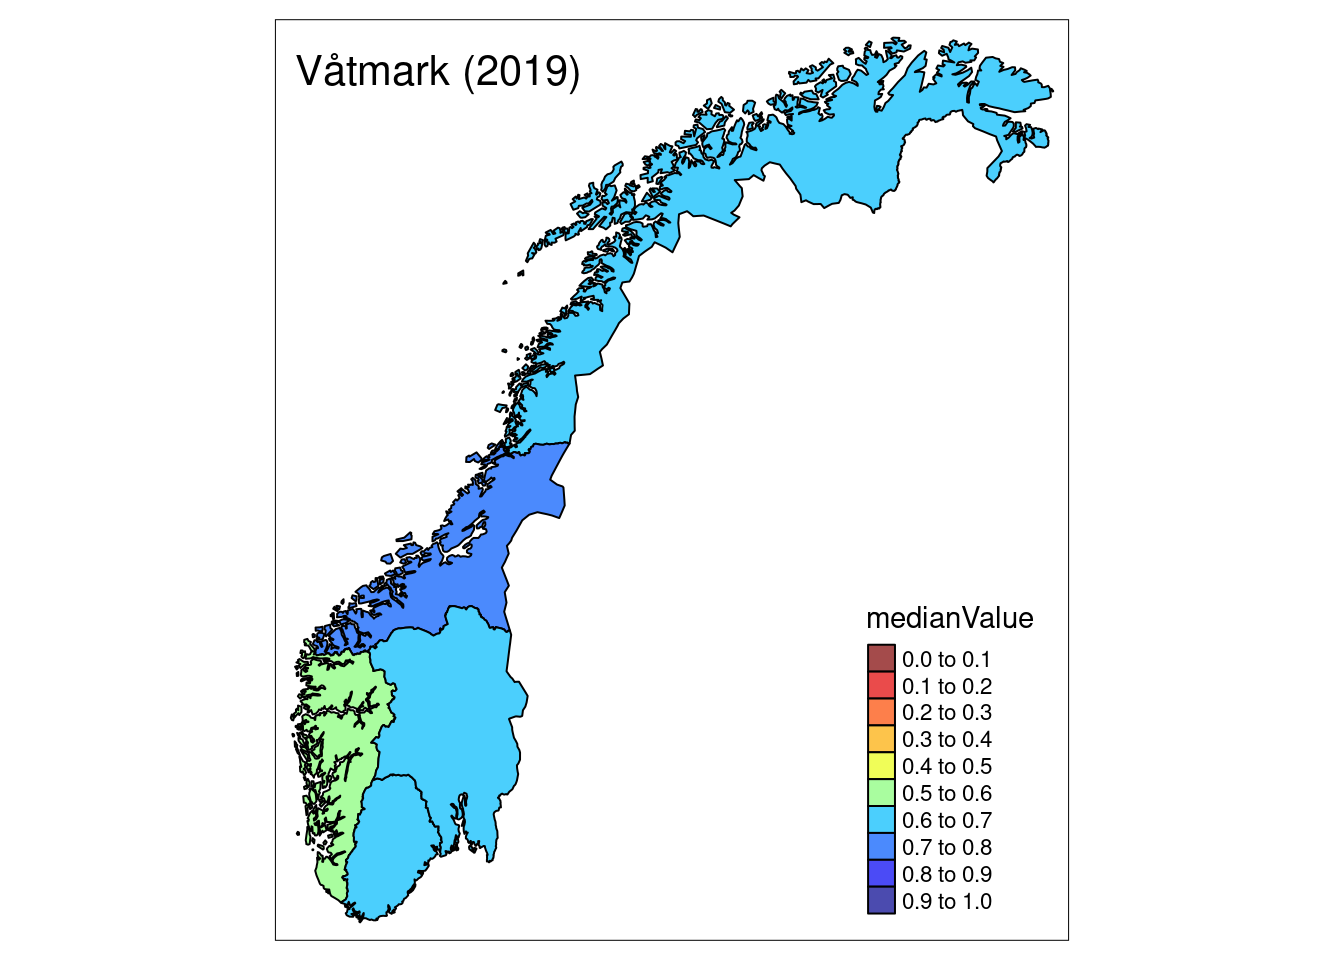
2.9.4 Uncertainty
Based on recent work done as part of a pilot study on visualizing NI products (https://ninanor.github.io/NIviz/index.html) I have also implemented some more advanced plotting functions. The first one plots a time-series as well, but including the entire uncertainty distribution, not just summary statistics:
Index <- CustomNI$CustomIndex

plotNI_DensityRidgeTS(Index = Index,
                      OutputType = OutputType,
                      ecosystem = ecosystem_use,
                      theme = theme,
                      allAreas = FALSE,
                      selectedArea  = "wholeArea")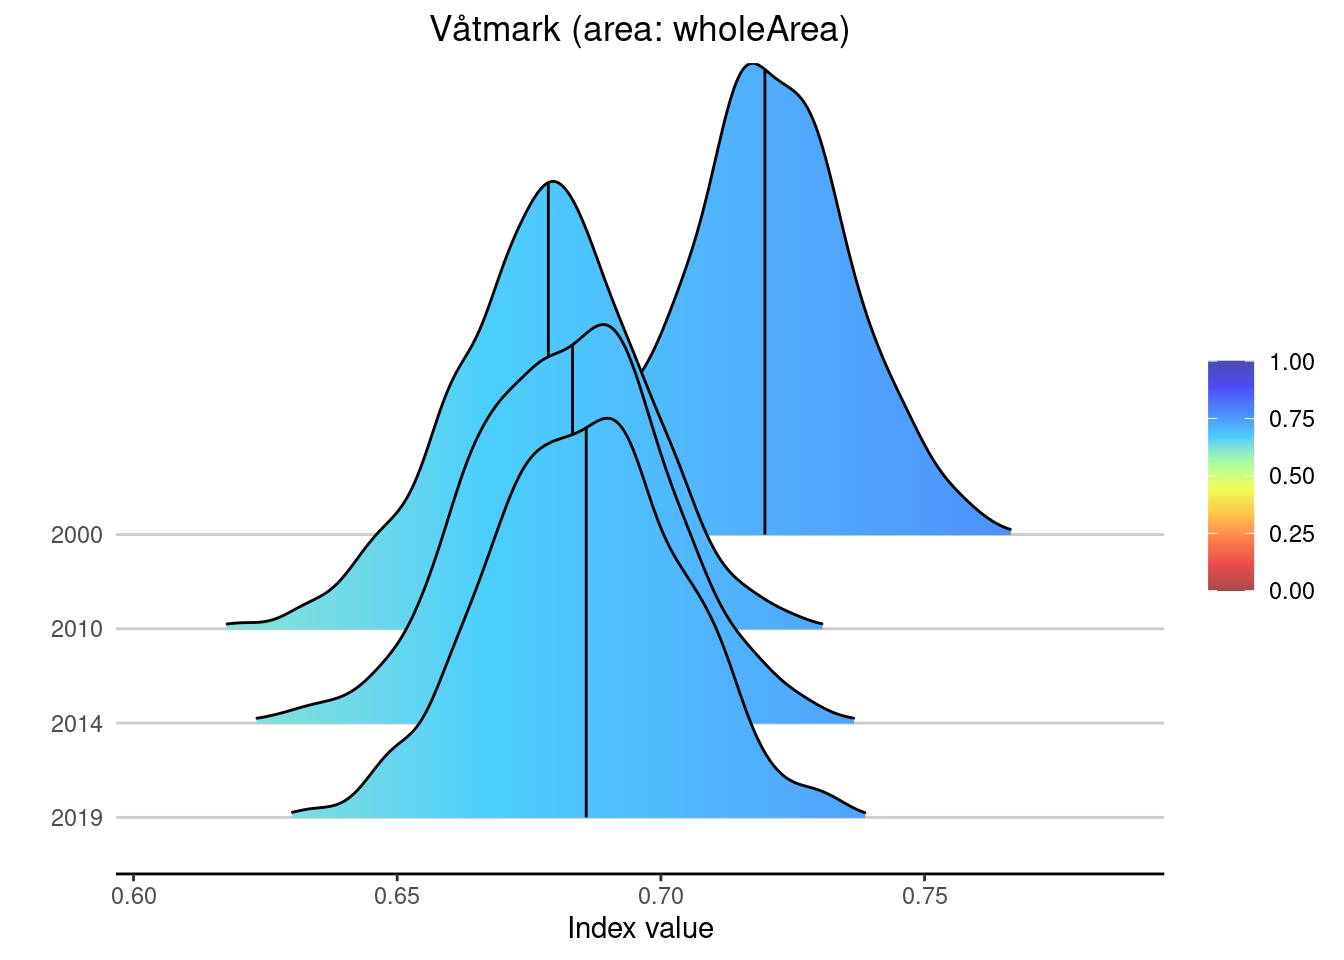
This works for plotting values averaged across the entire Norway as above, but also by area:
plotNI_DensityRidgeTS(Index = Index,
                      OutputType = OutputType,
                      ecosystem = ecosystem_use,
                      theme = theme,
                      allAreas = TRUE)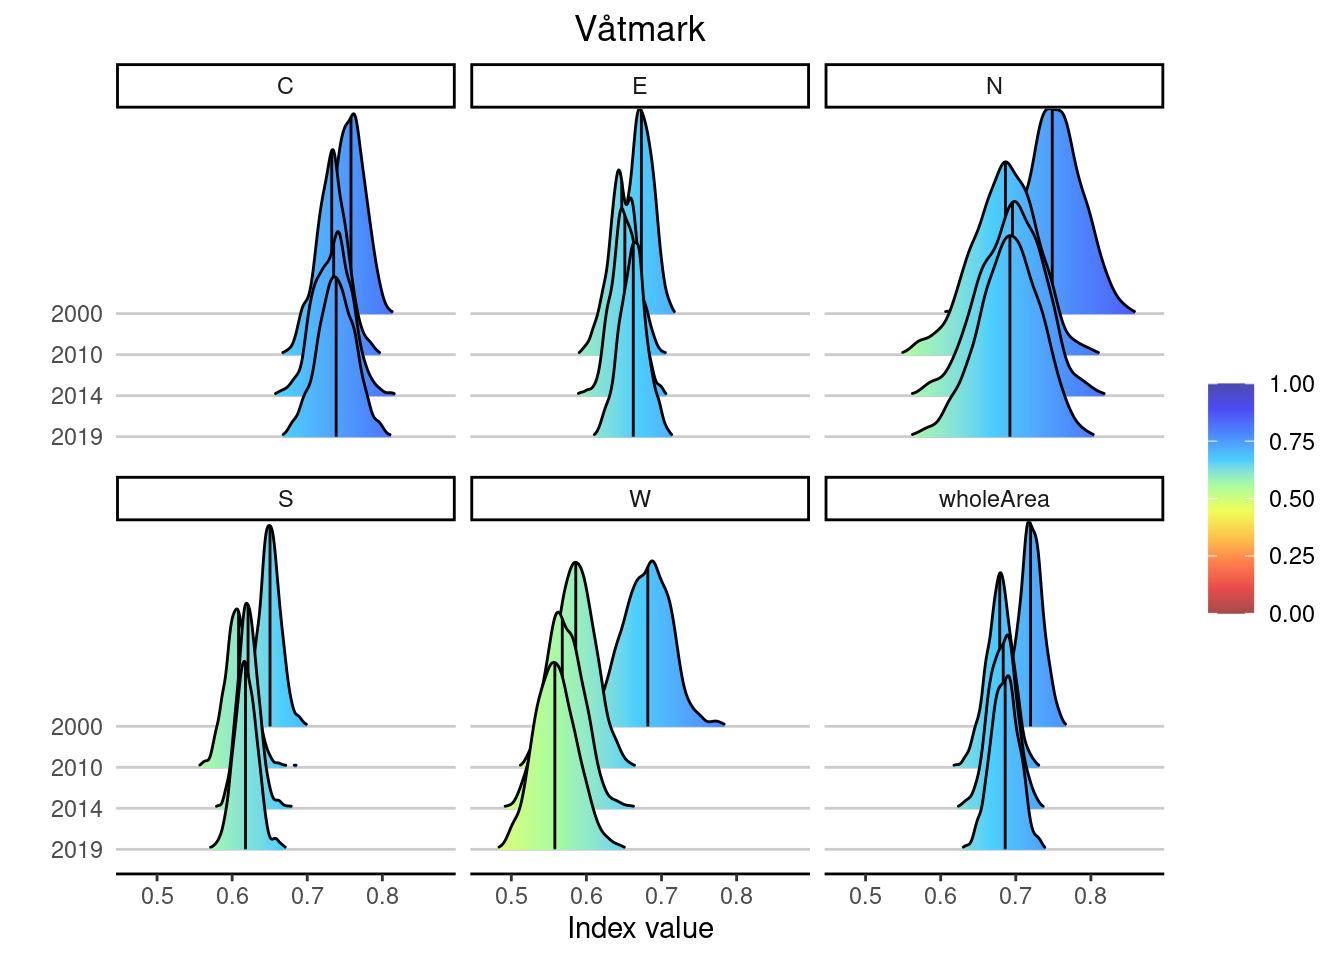
Uncertainty can also be visualized on a map alongside the median:
plotNI_Map(shp = CustomNI_map,
           year = 2019,
           OutputType = OutputType,
           ecosystem = ecosystem_use,
           plotMedian = TRUE, plotCI = TRUE, plotDisplacement = FALSE,
           interactiveMap = FALSE)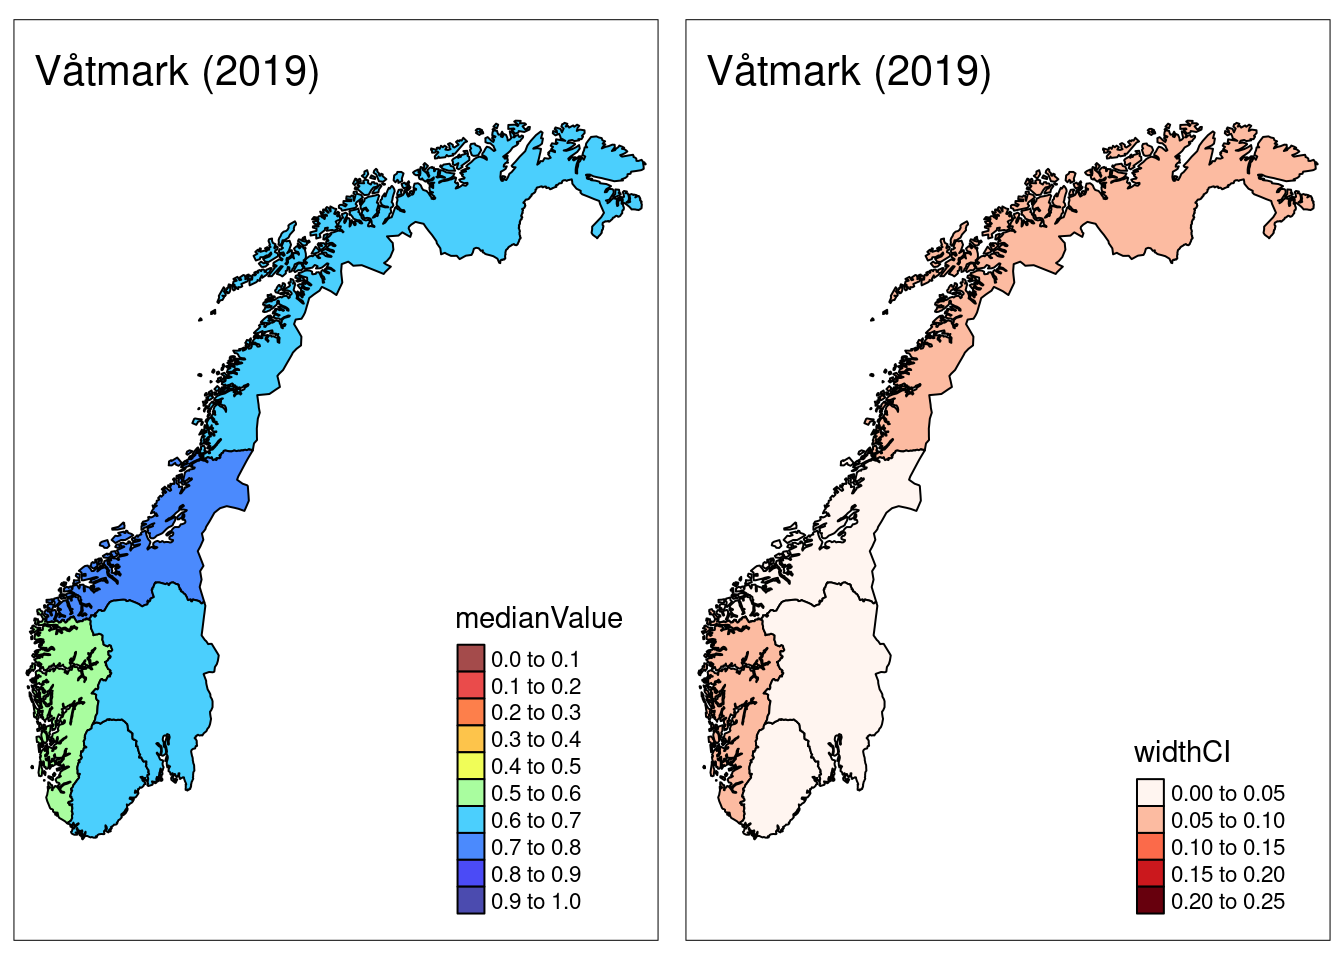
Finally, the plotNI_Map() function also supports the option of plotting “displacement”, which is a statistical artifact generated by the NI calculation routine.
In short, it’s a negative number that quantifies the degree to which the mean of the index is shifted away from 1 when scaling indicators.
The higher the displacement value, the more cautious one may want to be when making inference based on summary metrics alone:
plotNI_Map(shp = CustomNI_map,
year = 2019,
OutputType = OutputType,
ecosystem = ecosystem_use,
plotMedian = TRUE, plotCI = FALSE, plotDisplacement = TRUE,
interactiveMap = FALSE)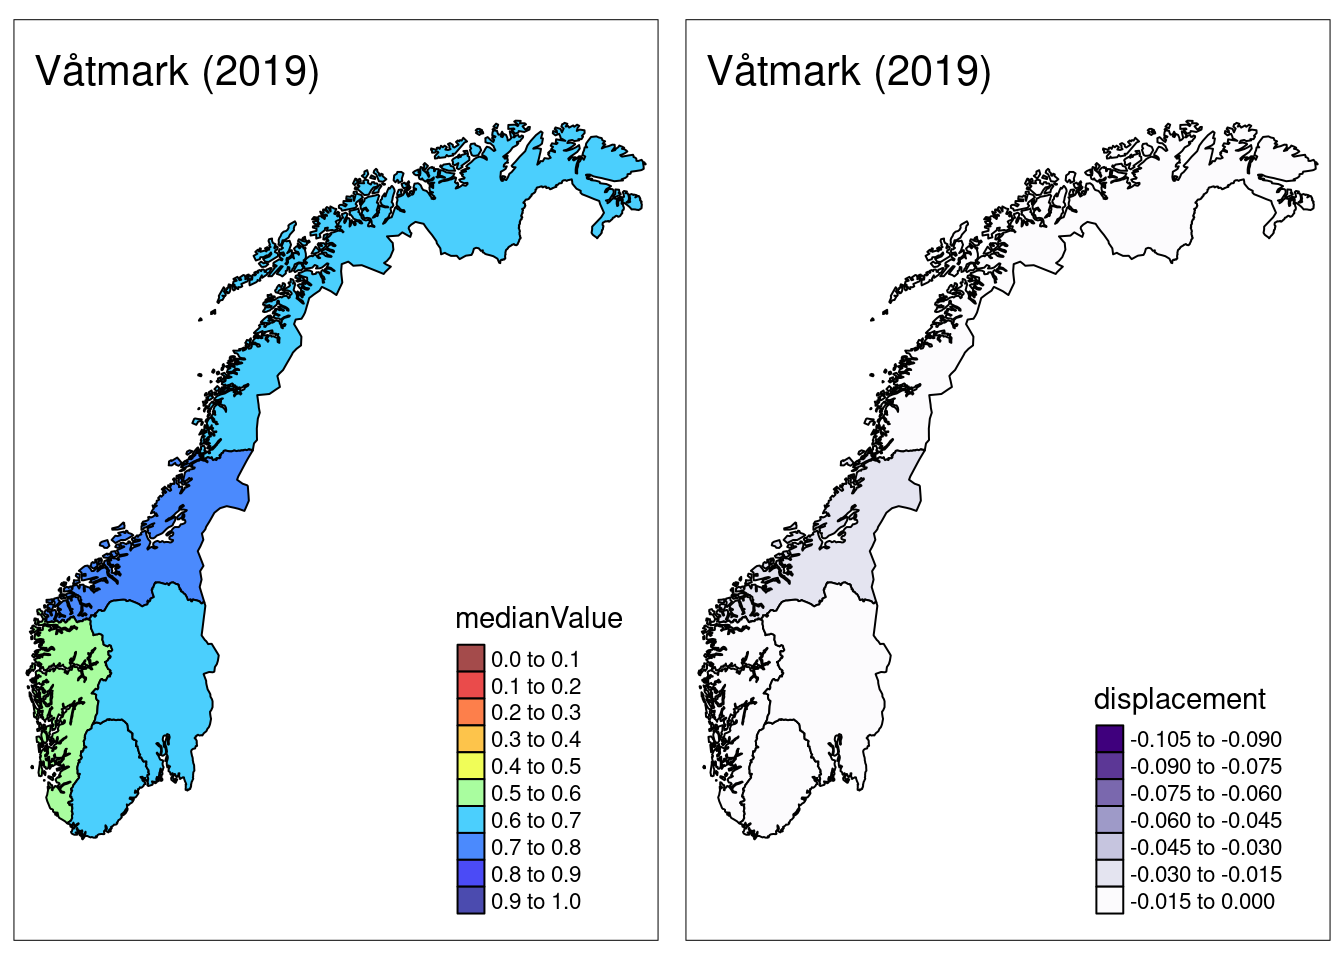 ## Prepare export {#prepare-export-ni}
Preparing the export is only a matter of renaming columns at this stage.
Using geomapNI() we have already extracted summaries and matched them to spatial data.
We can take the resulting object, CustomNI_map, rename the required columns to match the naming conventions outlined in the main document, add information on reference state, and remove columns that are not needed:
CustomNI_map <- CustomNI_map %>%
  dplyr::rename(v_2019 = meanValue,
                sd_2019 = standardDev) %>%
  dplyr::mutate(i_2019 = v_2019,
                reference_high = 1,
                reference_low = 0,
                thr = 0.6) %>%
  dplyr::select(-medianValue, -widthCI, -displacement)
Note that Nature Index products only exist as scaled variables.
For that reason, there is no difference between i_yyyy and v_yyyy.
2.2.4 Aditional comments about the dataset
There are missing values in the NI database. The proportion of missing data values depends on the individual indicators that are to be included in an NI product. As part of the NI analysis workflow, missing data values can be imputed using the MICE (Multivariate Imputation by Chained Equations) algorithm. This is an imputation procedure that uses (temporal) correlations among included indicators to make inference about missing values. Uncertainty due to NA imputation is propagated into the final NI product. Since the imputation procedure is based on correlations, it will be influenced by the composition of the dataset, i.e. the choice of indicators, years, and locations will affect the parameters in the imputation routine. For now, we recommend using data for all official NI years when calculating products with NA imputation as this will be the approach that most closely resembles the routine used for the official regular NI analyses. NI products can also be calculated without NA imputation. In that case, indicators with NA values in a given year get dropped from the NI product for that year, meaning that the same NI product for different years may contain a sightly different indicator set. This is no an issue unless the focus is on the time series itself, i.e. on the change in the characteristic that an NI product represents over time.